Help Isom IGA recover from devasting floods
COVID-19 |
2 min read
Forecast Your Local COVID-19 Impact with Oliver Wyman's Pandemic Navigator
Written by Jessica Vician
Jul 22, 2020
As COVID-19 cases increase and many states roll back to earlier phases of reopening, Oliver Wyman is helping IGA retailers prepare by making its COVID-19 Pandemic Navigator available to the entire Alliance.
IGA retailers can leverage the Navigator to see the predicted forecast for new and cumulative Coronavirus cases in their specific county and make business, staffing, and supply decisions based on those predictions.
The Navigator can also help retailers see how effective containment and suppression measures in their areas have been, gain insights into how to manage after the peak, and study future containment scenarios that may be needed until a vaccine or a scale treatment solution is in place. Here are the five main projection options the Navigator currently offers:
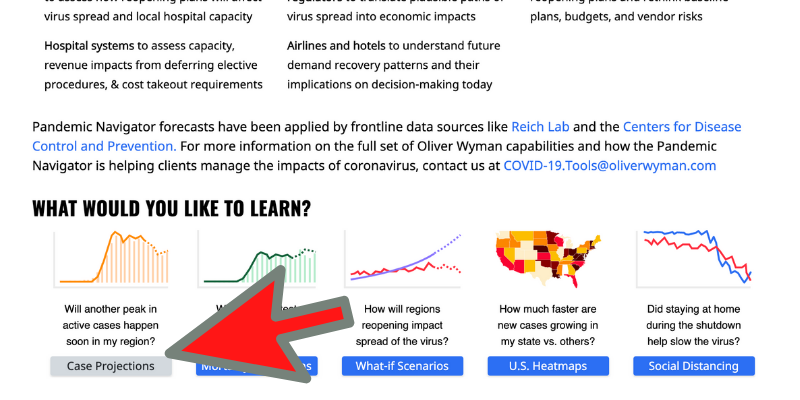
- Case Projections: will another peak in active cases happen soon in my region?
- Mortality Projections: what is the latest mortality forecast for my region?
- What-if Scenarios: how will regions reopening impact spread of the virus?
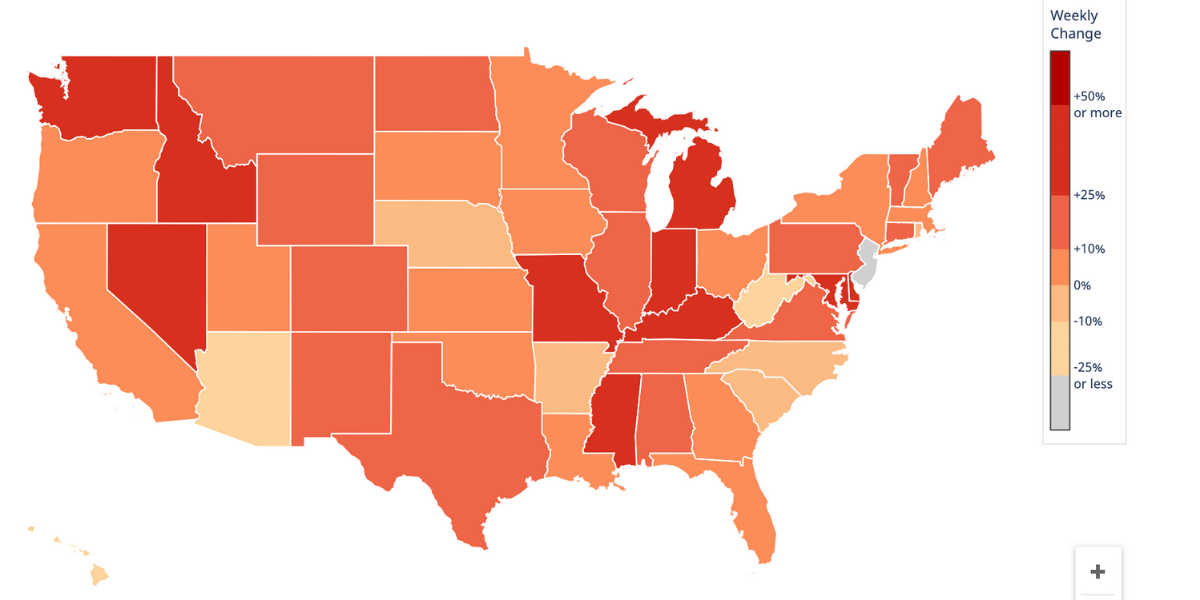
- U.S. Heatmaps: how much faster are cases growing in my state versus others?
- Social Distancing: did staying at home during the shutdown help slow the virus?
We have put a brief tutorial together to show IGA retailers how to use one of the Navigator's tools, the Case Projections tool, which will help retailers determine if another peak in active cases will happen soon in their region, allowing users to narrow down to their state and county.
To use, first select the "Case Projections" model from the home screen.
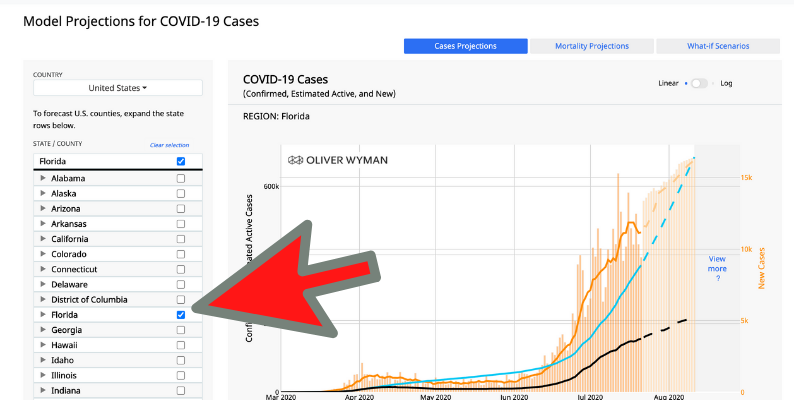
Then, on the left-hand side of the Case Projections model, select your state (in this example, we have selected Florida).
Finally, on the left-hand side of the Case Projections model (where you just selected your state), click the horizontal arrow to the left of the state name for a list of counties. Then select your county (in this case, we have selected Alachua County).
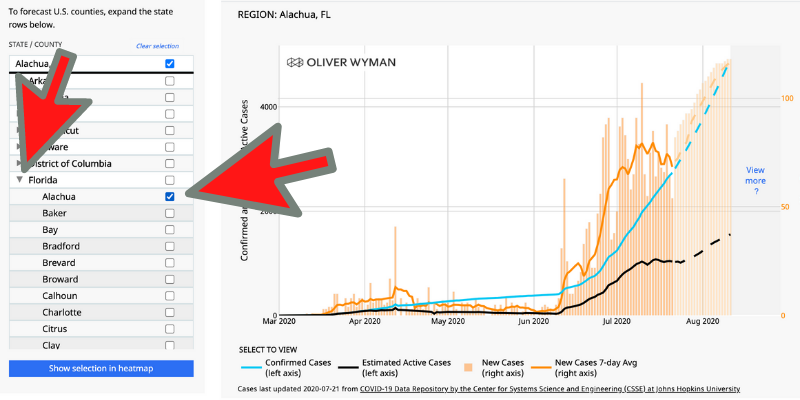
As you can see in the case projections graph on the right side of the image, for this example the confirmed cases (blue line) are expected to climb significantly throughout the rest of July and into August. If this example were an IGA retailer's county, they could prepare for this expected climb by potentially hiring and training more staff to compensate for sick employees, by ordering additional masks and cleaning supplies, and by planning to adjust shopping hours for both at-risk customers and for increased cleaning and sanitizing needs, etc.
Next Story
Updating the Assessment for COVID-19 →
You May Also Like
These Stories on COVID-19
Mar 9, 2022 10:53:54 PM |
2 min read



No Comments Yet
Let us know what you think